search
EN

RegioGraph TeamConnect — the digital workflow for team players


Remote work, multiple locations, interdisciplinary teams — today, more than ever before, we need tools to keep things running smoothly and enable digital collaboration. With RegioGraph TeamConnect, we offer an add-on to our established RegioGraph desktop software which allows you to share your geomarketing analyses, territory planning, and location assessments online. Your team can then access shared RegioGraph projects online via browser.

How do you share your data?
Get started now with RegioGraph TeamConnect:

  • Save time by convincing with meaningful results.

    Data visualization on digital maps provides a quick overview and makes regional correlations visible. Display or hide layers with different analyses or zoom into the map to take a closer look at customer data and locations.

  • Speed up your workflows by sharing up-to-date numbers at any time.

    In RegioGraph, you only have to adjust your user settings, access rights and visible layers once. All settings will be saved for future updates. In doing so, you are in control of who has access, what should be visible and can always keep your team up to date.

  • Simplify the exchange of information by communicating directly online.

    Your updates will be displayed as notifications in RegioGraph TeamConnect. So, everyone stays informed about all updates. If you want to exchange information with your colleagues, you can use comments and refer to a map section. Communicating has never been so easy!

  • Your data is securely stored on your own server.

    Your data is protected through storage on your company’s own web server. These are the technical requirements:

    EN_RegioGraph_TeamConnect_webserver


  • You don’t have your own web server? No problem!

    We’ve partnered up with cloudeo to provide you with a holistic solution:

    EN_RegioGraph_TeamConnect_cloudeo


    cloudeo_logo

    cloudeo operates a unique, vendor-independent, data-agnostic market platform through which customers can obtain professional geoinformation services from leading national and international providers at a low cost. Services include high-resolution imagery, 3D terrain models, thematic maps, and sensor data, all of which can be combined with a large selection of software packages, analytics, and IT that facilitate their processing for many industries, such as agriculture, urban planning, logistics, telecommunications, and water management. The cloud-based platform empowers new business models while enabling production automation, and facilitation in the delivery and administration processes.

    Find out more...


A guided tour through RegioGraph TeamConnect:

Perfect map design
Data visualization
Sales territory changes
Data analysis
Communication
  • RegioGraph_TeamConnect_Rundgang_1
    • Get up-to-date data analyses from RegioGraph online as an interactive map. This provides you with details at every zoom level.

    • Showing/hiding layers makes it easier to analyze your data.

    • For example, display topography and roads for orientation only as long as you need them.

    GO TO GUIDED TOUR

  • RegioGraph_TeamConnect_Rundgang_2

    The wide range of display options from RegioGraph increases the informative value of the split analyses:

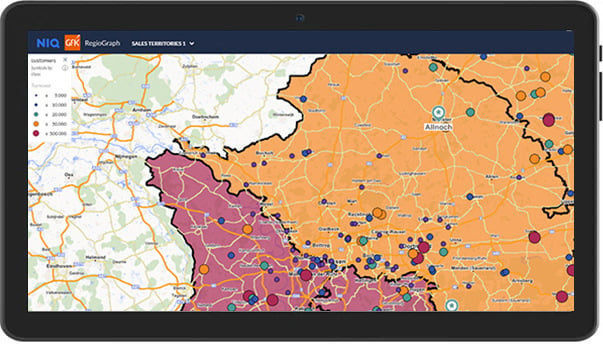
    • Customer points can be mapped according to sales volume.

    • The star display and coloring show which customers are assigned to which sales representative.

    • You can identify whether a customer is located outside the territory.

    GO TO GUIDED TOUR

  • RegioGraph_TeamConnect_Rundgang_3
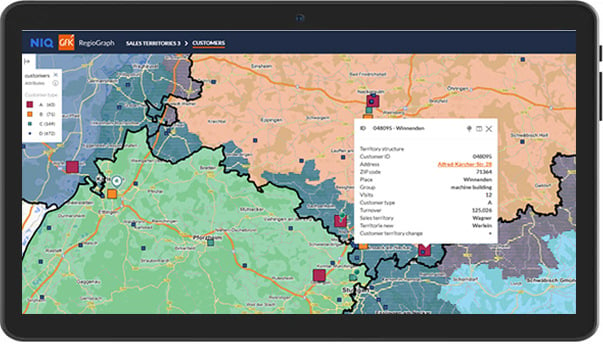
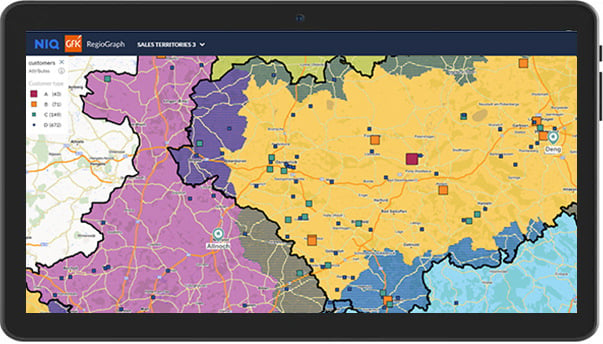
    • View individual sales territories and look at customer distribution and ABC classification.

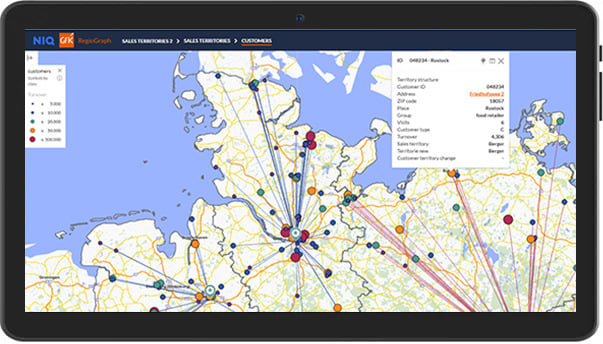
    • The map display allows you to see at a glance which customers are affected by the sales territory change.

    • For a closer look at the key figures of a new customer, you can "pin" it at the bottom.

    GO TO GUIDED TOUR

  • RegioGraph_TeamConnect_Rundgang_4
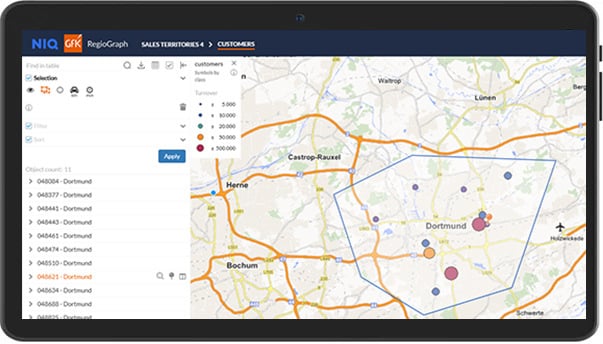
    • All stored data can be found in the overall table.

    • By searching, filtering and sorting you can easily evaluate your data.

    • Your results can be downloaded as Excel or CSV.

    GO TO GUIDED TOUR

  • RegioGraph_TeamConnect_Rundgang_5
    • Updates and changes are displayed as notifications.

    • If you want to exchange information with your colleagues, you can use comments.

    • Refer to a map section to clarify your comment.

    GO TO GUIDED TOUR