Experience the countless benefits of geomarketing with our software RegioGraph, which allows you to display and analyze your data on digital maps. Restructure your sales territories. Find promising regions for new locations. Leverage market data insights to guide your multi-channel campaigns. Accomplish this and more through RegioGraph’s wide range of analytic tools for applications across your entire business, from sales and marketing to expansion and controlling.

Have your results or the conditions in your territories changed significantly, perhaps requiring a restructuring?
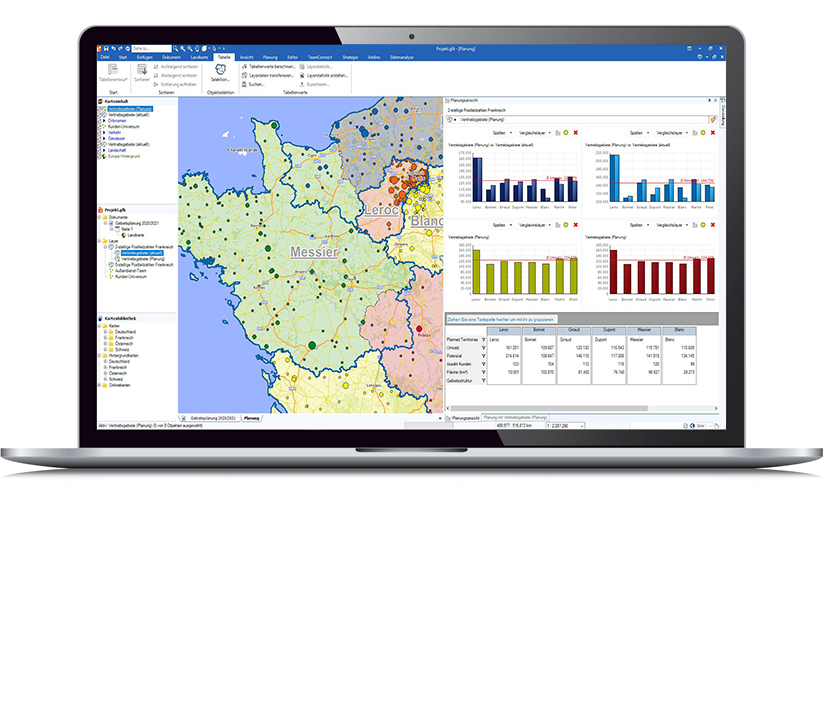
Import your sales territories and employee assignments into RegioGraph and display them on a digital map in just a few clicks. A new planning interface lets you simultaneously analyze your data on a map, in charts and in a table, giving you more control. Make use of professional tools that support numerous applications, such as automatically balancing your sales territories according to workload and potential, among other criteria. Manage substitutes and develop sales hierarchies and planning scenarios. Regardless of the task, RegioGraph saves you valuable time!
Display all territory changes on a map to maintain an overview. Present results to your team in the form of a report or even as an online interactive map using the RegioGraph TeamConnect add-on.

Do you need more insights on your target group in order to plan more successful marketing campaigns and use your resources more effectively?
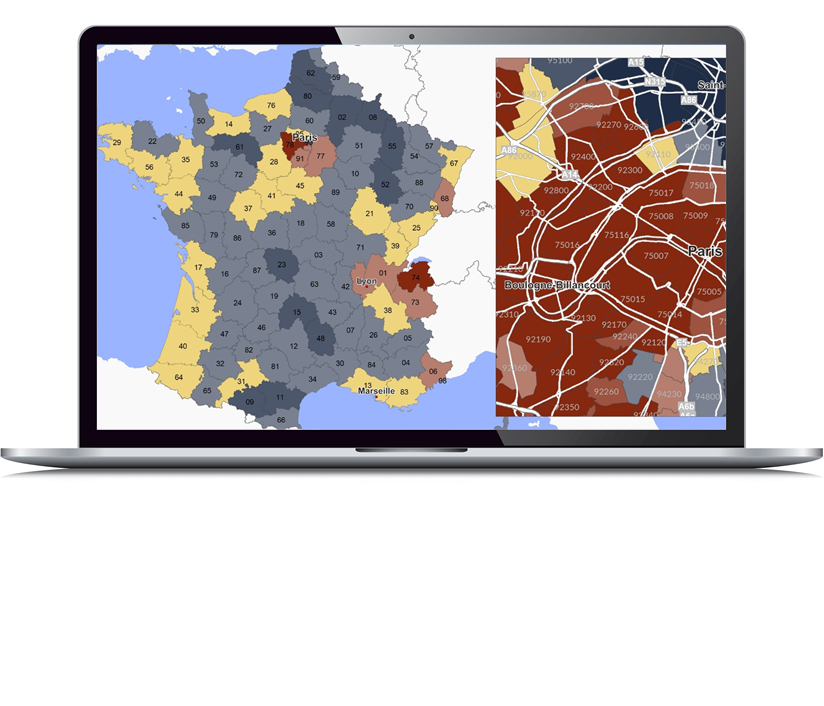
RegioGraph doesn’t just simplify your campaign planning - it takes it to a whole new level. The software allows you to display and analyze any data with a geographic component on digital maps, such as information on customers, competitors and market potential. This reveals the regional distribution of your customers and turnover, while also giving you the option to enrich these insights with GfK market data, such as purchasing power and information on income level and household types. You’ll know exactly who your target group is and the location of promising regions with the same profile. This also lets you advertise with greater precision and avoid wasting resources.
The software additionally gives you options for evaluating your performance. For example, use a map analysis to see which income group had the best response to your campaign.

Do you face critical location decisions and want to make sure you consider all relevant factors?
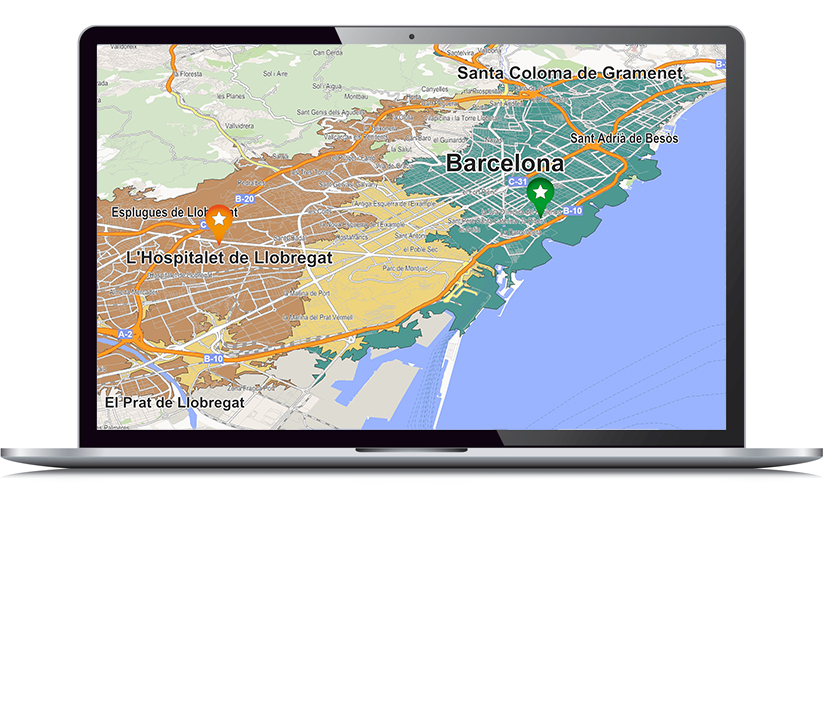
Use RegioGraph to map your location network and link information on your customers, target group potential and competitors. Analyze your catchment areas (e.g., based on driving time) and compare KPIs of individual locations. The software's data analysis tools pinpoint target groups and market potential down to the level of street segments. Spot gaps in your location network or cannibalization effects and then use these insights to make informed decisions on prospective and existing locations.
Take advantage of RegioGraph LocationAdvice, which is an online, browser-based application that allows you and your team to analyze locations and their surroundings, even when away from the office. Get quick, consistent results and then communicate them seamlessly with all stakeholders.

Do you have large volumes of information in your database or spread out across numerous spreadsheets?
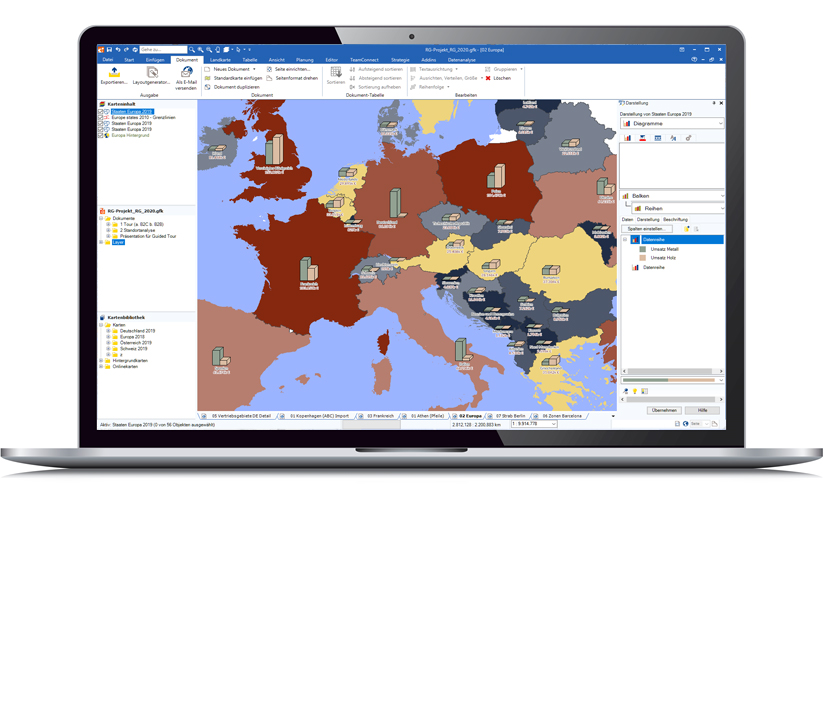
RegioGraph helps you make sense of this data by using geographic information such as addresses to visualize your customers, turnover and locations on digital maps. This reveals complex patterns and relationships that would otherwise go unnoticed.
Select from diverse analyses such as ABC, customer density, portfolio and charts, among many others. Create catchment areas around your locations. View the regional distribution of your customers and turnover. Compare the turnover of individual regions or in a radius around a location. Evaluate your market penetration by comparing your turnover to the included GfK Purchasing Power.
This shows you where your turnover is optimal as well as where you can find untapped market potential.
